Examples
In this article we'll show examples of the most typical visualizations in Obsidian
TYPE | EXAMPLE |
|---|---|
Business process with timeline (obsidian 3.0) Isometric representation a business process impacted by IT Services Template SVG design |
|
Hexagon maps Automatic interactive representation based on hexagons, showing SLA breaks, availability/capacity issues, root cause analysis, NLG explanation, etc. Automatic |
|
Sunburst diagrams Alternative representation to the previous, but showing all levels at the same time. Automatic |
|
Business Impact (I) Fira de Barcelona example, showing wifi and networking issues per location SVG design |
|
Business Impact (II) PwC Madrid tower example, showing wifi capacity and networking issues per location SVG design |
|
Workflow (I) Isometric representation of workflows or process steps, highlighting alerts, availability/capacity issues, root cause analysis, NLG explanation, etc. Template SVG design |
|
Workflow (II) Interactive version of the previous one, allowing to click and access detailed views Template SVG design |
|
Hiearchical map Isometric representation of dependencies among services, showing SLA breaks, active alerts, availability/capacity issues, root cause analysis, NLG explanation, etc. Online editor SVG design |
|
Datacenter view Isometric representation of racks and servers in a datacenter SVG design |
|
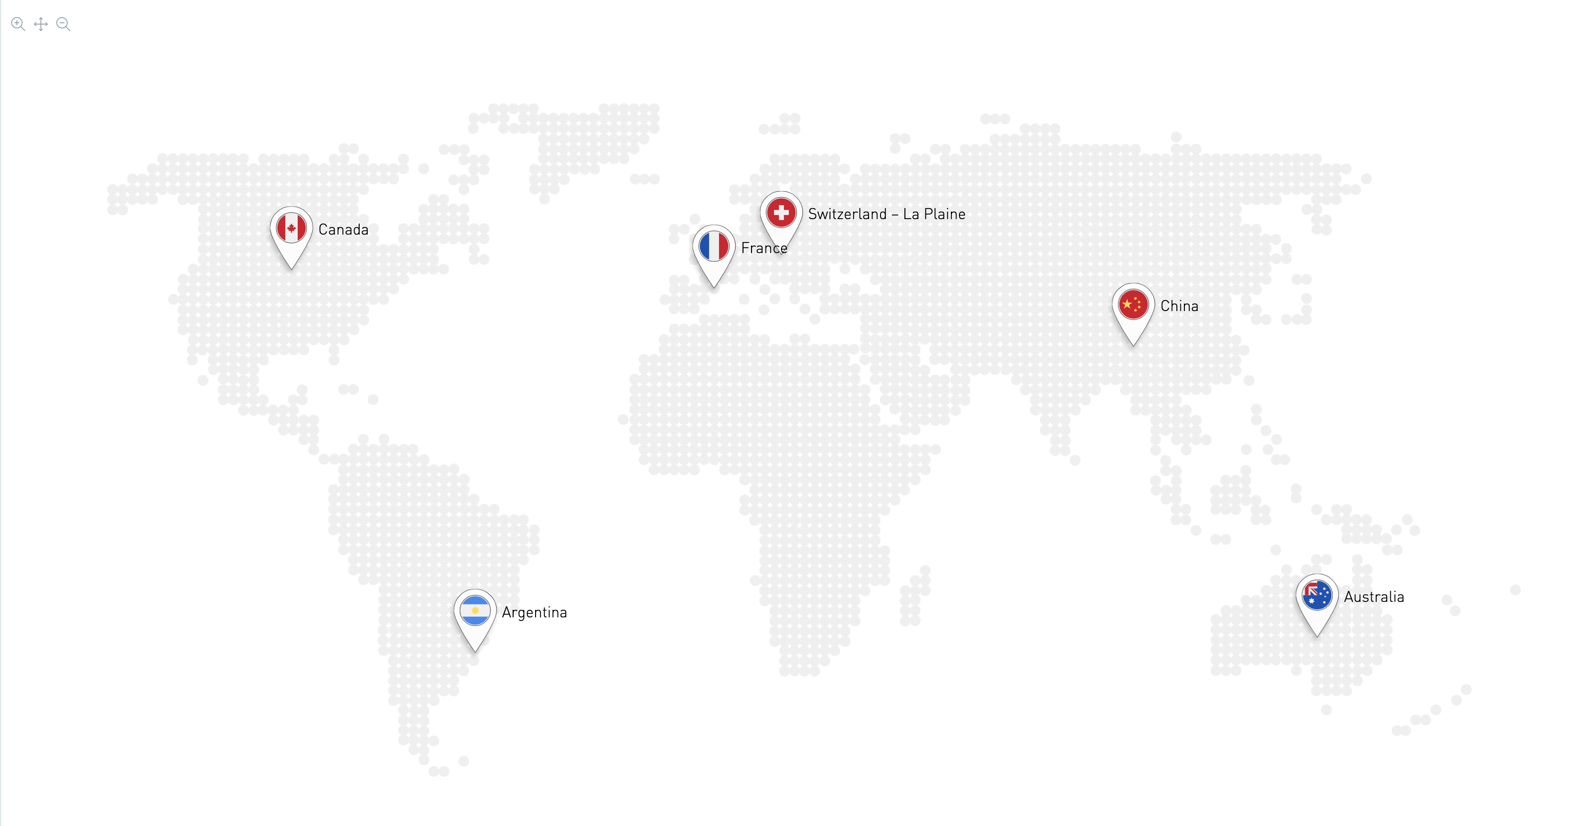
Map Any type of map representing locations and their associated service level Template SVG design |
|
Infrastructure map Isometric representation of the datacenter infrastructure, highlighting alerts, availability/capacity issues, root cause analysis, NLG explanation, etc. Online editor SVG design |
|